In my last post I talked about how to detect performance issues related to unoptimized MDX and different strategies based on the type of issue. A big part of ensuring that you are as efficient as possible with your troubleshooting efforts is to first identify if the bottleneck is in the Formula Engine (FE) or Storage Engine (SE). Technically unoptimized MDX itself is likely to manifest as an FE bottleneck where an SE bottleneck really resides more with the underlying cube architecture. That said, all of this really ties back to the first post and the anatomy of an MDX query.
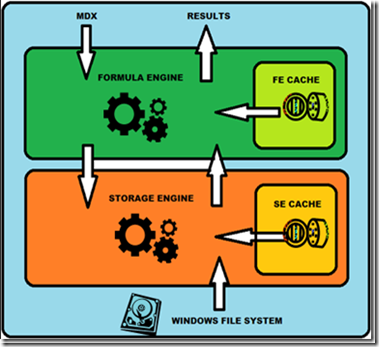
In part 1, I walked through the anatomy of an MDX query and described what role the FE and SE play in the handling of a request. When troubleshooting slow MDX performance, it’s not likely that the bottleneck is entirely with the FE or entirely with the SE. So how do you tell where the biggest bottleneck is, so you can ensure you are getting the most out of your tuning efforts?
Where is SSAS spending most of its time?
To put it simply, if SSAS is spending most of its time in the FE while handling a request, that’s where you should start your troubleshooting; likewise for the SE. But how can you accurately measure something like that? The most accurate way using native tools is a trace. There are certain trace events in SSAS that map closely to the activity we covered in the “anatomy of MDX” discussion. I’ll break them down here:
SSAS Trace Events
Command Begin/End – This signifies the beginning/end of an XMLA command. This is often associated with processing activity.
Query Begin/End - This encapsulates MDX, or other queries like DMX, SQL, etc. from request submission to results returned.
Query Subcube/Verbose – The FE requests data from the SE
Get Data From Cache – There was a cache hit to either the SE or FE caches. The event subclass will tell you which.
Progress Report Begin/End – This indicates SE file system activity either for processing or querying. The event subclass will tell you which.
Get Data From Aggregation – This indicates the SE made use of an aggregation to return data from the file system.
There are other events and additional detail that is provided within the trace, but this covers the primary events we’ve discussed. Note there can be many of these events, excluding the command or query begin and end, for a single request and it can get a bit complicated fairly quickly, especially if there are multiple requests hitting the server at the same time. However, if you are troubleshooting a particular query and run a trace, you do have the information to add up the duration for each event and come up with an idea of where most of the time is being spent.
Fortunately, SQL Sentry PA for SSAS does all of this for you! You may have noticed a rather unique chart on the PA for SSAS dashboard.
This chart monitors all of this activity for you continuously at a fraction of the overhead a Profiler trace tends to impart. It summarizes this information in real time and retains history so you can quickly and easily see where most of the time is being spent. It even breaks it down into more detail for you. Serialization is handled by the FE and is related to Non Empty behavior as discussed in an earlier post. Processing and SQL queries are handled by the SE. By the way, SQL queries are likely due to data reads for processing, but can also be seen if you are using ROLAP partitions.
For a further breakdown of this activity on a query by query basis in PA for SSAS, refer to the Top Queries tab. Not only will you see if your query experienced more FE or SE time, but you can expand the view for a complete breakdown by Measure Group, Partition, Aggregation, and Dimension. More information on this functionality is available on the website.
In the next post I’ll dig into troubleshooting server resource bottlenecks specific to SSAS. We’ll take a closer look at the hardware side of things and discuss some configuration options to ensure your server is properly tuned.


