Thursday, October 10, 2013

PASS Summiteers Guide to SQL Pub Crawls

During the last few days’ preparations for the PASS Summit opening in my home town of Charlotte, the idea was tossed around that a pub crawl may be in order. This got me thinking and I’m hoping to lead one next week for anyone that is interested in joining me! It looks like Thursday would work best and I’m actually working on a couple of options. One would make use of the SQL Sentry Shuttle which would allow us to include NoDa and other locations just outside uptown. The other would be an uptown walking loop, as there are plenty of great pubs within walking distance of the Charlotte Convention Center and the many hotels where Summiteers will be staying.

DINING-ROOM-1024x682

Alexander Michael’s Tavern

Live Updates

In preparation, I’ll be using the Twitter hashtag, #SQLPubCrawl. If I am able to lead this first hand, I’ll post updates and let people know where we are live as the crawl commences. This will also allow anyone to post questions any time from now till the end of the Summit. Maybe you’ve stumbled on a great place with great music, or an unbelievable drink special. Anyone could use the #SQLPubCrawl hashtag to spread the word to the rest of the SQL community!

In case I’m personally unable to lead the crawl, or if there’s enough interest in more than one, I’ve decided to post a couple of options that anyone can follow. Note I’ll refer to the Summit Map & Area Guide as much as possible to make it really easy for anyone interested to guide yourself or your own group throughout the city. Also refer to Greg Gonzalez’s (@SQLsensei) blog on The Craft Beer Scene in Charlotte and Uptown After Hours for more ideas. Some of the stops I’ll mention, while on the map, are not detailed in Greg’s blog. There’s also a chance other SQL Sentry teammates may lead other crawls if the demand calls for it.

Before I detail the possible routes, I actually want to mention one pub that is a bit removed from the rest in uptown but, you should try to get there if you can. That is Alexander Michael’s in Charlotte’s historic 4th Ward. If I lead a crawl, I’m going to try to arrange a special shuttle stop there before starting the rest of the crawl. I would start there as they officially close at 10pm but may stay open later if there are enough customers to do so.

Alexander Michael’s Tavern (Fourth Ward: marker 38)

From their website… “In January 1983 A. Michael Troiano Jr. & Alexander Copeland III (now you know where the name came from) opened a Restaurant & Tavern in the newly revitalized “4th Ward” of Charlotte, North Carolina. It occupies what is historically known as the Crowell-Berryhill Store that originally opened in 1897… The Bar and Back Bar were made from solid oak doors that were originally in the Independence Building which stood on the square at Trade & Tryon streets. The beer cooler is circa 1920 from a Charlotte grocery store.”

As you can see from the map it’s only about a six block walk from stop 3 of the SQL Sentry Shuttle, and worth the side trip. If I can, I’ll try to lead a crawl that provides a “special stop” near there to kick off the crawl. Otherwise an uptown walking tour should start at historic Brevard Court which is two blocks west of the Convention Center straight down MLK Jr. Blvd.

The Walking Tour

Zapato

Note I’m including the shuttle stop numbers for navigation purposes only, as the following pubs are listed in order of an easy walking route around uptown Charlotte.

Brevard Court (area C: stop 7)

Courtyard Hooligans (marker 20)

Set in one of the most unique and interesting areas of uptown Charlotte, Hooligans describes itself as “…an International Sports Pub with a large import and craft beer selection, along with full liquor bar. The Sports focus is on International sports (soccer/football rugby etc.) along with NFL, NBA, NHL, MLS, and MLB.” If you go, you may want to ensure you know the Manchester United song. Those hooligan’s take their football seriously. If you don’t believe me, just watch this YouTube clip from the last group who went in unprepared. Be forewarned there is one instance of vulgar language in the clip.

The Belfast Mill (marker 19)

I know what you’re thinking, “Another faux Irish themed bar”. Not the case here. In addition to being located in Brevard Court, The Belfast Mill has gained a reputation for being authentic and unassuming. This is a great place to relax and hoist a pint.

Valhalla (marker 23)

From their website…” Named for the "Hall of Slain" featured in Norse Mythology. Valhalla is decked out of brick and wood paneled walls, dark wood benches and dimmed lights (Bring your own breast plates and horned hats). A good selection of beers flows freely along with wine and a nice line-up of single-malt Scotch, while feasting is covered by a Scandinavian inspired pub menu.”

Now we leave Brevard Court and head a couple blocks north to 5th Street. If you haven’t already, and are up to the walk, make the detour to Alexander Michael’s on 9th and Pine now if it’s before 10pm. Otherwise head to:

Dandelion Market (Uptown: Stop 6 or 3, marker 50)

“Taking its name from the famous outdoor market that thrived in Dublin back in the early 70's, Dandelion Market provides Uptown Charlotte with a place for friends and family to gather and enjoy the best in food and drink, served with a smile, in a cozy pub setting.” Note there are bars on both floors, so if things seem crowded downstairs, see if the accommodations are better on the second floor.

Connolly’s on 5th (Uptown, Stop 3, marker 49)

“You are not likely to find your matching shillelagh and shamrock sweater, what you will find are good times, new friends and great beers. If the action inside gets too much, chill out on the largest patio in downtown Charlotte.” Connolly’s is easily one of the most popular downtown pubs, and centrally located even if not on a pub crawl.

EpiCentre (area A: stop 2)

BlackFinn American Saloon (marker 1)

“BlackFinn American Saloon is a modern day adaptation of a "big-city" saloon, with the welcoming charm and friendly faces found in the traditional neighborhood tavern of yesteryear.”  BlackFinn also has two floors, so feel free to check out both to find a spot to settle in with a drink.

Mortimer’s Pub (marker 5)

Even though the EpiCentre is a fairly new development to uptown Charlotte, Mortimer’s still manages to provide that old town pub feel. It actually sits on a cobblestone alley within EpiCentre that feels like it’s more hidden away from all the surrounding shops and restaurants.

That should be sufficient for a full night’s walking tour of some of the most notable pubs in uptown Charlotte. If you notice on the map, Alexander Michael’s aside, it’s more or less a big clockwise loop starting at the Convention Center, and ending just north of there at EpiCentre.

Now for a variation, I’d like to offer taking advantage of the SQL Sentry Shuttle and mention some locations that are well worth the trip.

The Shuttle Tour

trolley[16]

From the Convention Center take the shuttle to stop 9, NoDa neighborhood center.

Revolution Pizza and Ale House (NoDa : stop 9, marker 33)

Basically a converted house on the main intersection of this eclectic neighborhood, Revolution has a large selection of craft beers on tap and in bottles from NC along with many of the most popular ones from other locales. The also offer a great food selection and plenty of outdoor seating.

Growlers Pourhouse (Noda: stop 9, marker 29)

As Greg mentions, “Voted one of "America's 100 best beer bars" the past two years running, Growlers has 14 rotating taps, including a refurbished 1936 beer engine for serving hand pulled cask ales. You will also not find a more beer-friendly menu in Charlotte.” 

Heist Brewing (NoDa: stop 9, marker 30)

The only actual brewery I’m including as it has the most convenient location to include in this crawl. That said, a brewery crawl in itself is a great idea. So many options! Anyway, Heist is also one of the recent additions to Charlotte’s craft brewing scene, and has quickly established itself, not only as a great brewery, but also a place for terrific food.

Now head back to shuttle stop 9 for a ride to the NC Music Factory, area B on the map.

Small Bar (NC Music Factory, stop 4, marker 15)

Small Bar actually was built in the space of an old loading dock in the NC Music Factory complex. It’s worth a stop simply for the novelty. It’s roughly 900 square feet, but they do have a large patio to go with it. They’ve mostly made their reputation on the novelty as well as very reasonable prices on drinks.

Now you can either hop back on the shuttle to stop 5 or take a short walk around the Music Factory complex to VBGB’s.

VBGB’s (NC Music Factory, stop 5, marker 17)

Compared to Small Bar, VBGB’s will seem very big. In fact, VBGB stands for “Very Big German Beer”. They have a great selection of craft beers on tap, a frost rail that runs along the entire bar, and a huge outdoor patio out back with all kinds of games and entertainment. While you’re there take a minute to admire the 40+ year old neon JFG Coffee sign which was preserved by Historic Charlotte.

Well I think I’ve covered quite a bit. As I mentioned, I could go on forever with all the options available, but I’ll stop here. If you have time after NC Music Factory, I’d definitely add stop 7, Brevard Court, on your way back to central uptown with all the options I listed there. That will certainly provide for a full evening’s entertainment.

Keep an eye on #SQLPubCrawl on twitter for more info and hopefully live updates throughout the Summit, and feel free to ask for any additional tips along the way. Cheers!

Thursday, June 7, 2012

Database Mirror Monitoring and Automation with SQL Sentry

The Challenge

Since its introduction in SQL 2005 SP1, mirroring has become a common method to provide high availability for critical databases. With any HA strategy, proper monitoring is a must to ensure everything is working as planned with minimal data loss and disruption incurred in the event of a failover.

SQL Server provides several pertinent performance counters, as well as the Database Mirroring Monitor, to provide a base level of visibility into mirroring. Unfortunately there are known issues with alerting on mirroring thresholds as listed in Microsoft Connect here.

The issue is marked as ”Closed as Won’t Fix”, which leaves us with the need for a workaround.

The discovery of this led me to write this post. Not only will I provide scripts to configure a workaround, but I’ll show you how you can gain additional visibility and automation by combining this solution with SQL Sentry’s comprehensive monitoring and alerting capabilities.

While still available, mirroring will likely be used less in SQL Server 2012. The new Always On technology provides many enhancements over other HA options, and I’ll likely write a post about that in the future. See Aaron Bertrand’s (b|t) blog post on TechNet for an overview.

That said, I don’t suspect everyone will immediately upgrade to this new technology, so mirroring will be around for a while.

I first began my search through connect after reading the TechNet article on Alerting on Database Mirroring Events.

After some testing I quickly realized the solution wasn’t working as the alerts were database specific. Changing the "Database name:" field in the alert definition to <All Databases> in the alert properties fixed the issue. This may be sufficient if you only have one database mirrored on this server, but not if you have more than one since the alerts, and really the underlying error messages themselves, don’t provide for a database name.

I considered several options for a workaround. Ultimately, I wanted to make use of what native resources were reliable and practical as I didn’t want to reinvent the wheel. I know many people use a lot of the native functionality as covered in the MSDN article, Monitoring Mirroring Status, which discusses the dbmmonitor system stored procedures.

The Solution

So, my solution was to generate new error messages to replace the four native mirror performance errors. They are listed in the Technet article with Error numbers, 32040, 32042, 32043, and 32044. The below script creates new ones where I’ve replaced the leading 3 with a 5. The error messages are essentially the same as the original, except I’ve added a parameter for a database name. If you’ve already created your own custom error messages with those numbers, you’ll want to modify the script accordingly.

-- Create custom mirroring error messages to replace native ones so they can be database specific.
-- Error numbers are same as native, except leading 3 is replaced with a 5.
-- Severity level is 10, but error numbers and severity levels can be modified to suit your environment. 
-- Created by: Steven Wright, SQL Sentry
 
USE master
-- Check to see if there is already an error with this ID in sysmessages
IF EXISTS (SELECT 1 FROM sys.sysmessages WHERE error IN (52040, 52042, 52043, 52044))
    -- If there is, abort the script 
BEGIN 
    RAISERROR (N'At least one message with this error ID is in use.', 16, 1) 
END
ELSE
BEGIN
    EXEC sp_addmessage    @msgnum= 52040,
                        @severity= 10,
                        @msgtext= N'The oldest unsent transaction for %s is now %d.  The alert threshold is %d.',
                        @with_log= 'TRUE'
    EXEC sp_addmessage    @msgnum= 52042,
                        @severity= 10,
                        @msgtext= N'The Log Send Queue for %s is now %d KB.  The alert threshold is %d KB.',
                        @with_log= 'TRUE';
    EXEC sp_addmessage    @msgnum= 52043,
                        @severity= 10,
                        @msgtext= N'The Redo Queue for %s is now %d KB.  The alert threshold is %d KB.',
                        @with_log= 'TRUE';
    EXEC sp_addmessage    @msgnum= 52044,
                        @severity= 10,
                        @msgtext= N'The mirror commit overhead for %s is now %d ms.  The alert threshold is %d ms.',
                        @with_log= 'TRUE';
END

Download the script directly here: Create_Mirror_Error_Msgs.sql

Now that we’ve created these enhanced error messages, we need to ensure that they are the ones raised when your mirroring performance thresholds are exceeded. I’m referring to the standard warning thresholds you can set natively in SQL Server as described in MSDN.

Normally these errors are raised after a check by sp_dbmmonitorupdate. If you’ve used sp_dbmmonitoraddmonitoring to set things up, you should have a job on your server called ‘Database Mirroring Monitor Job’ that runs the update proc at scheduled intervals.

Below is a script to create a replacement proc called sp_Sentry_dbmmonitorupdate that is otherwise identical, but raises our newly created errors and passes a database name to give us more complete details. Simply replace the call to the native proc in the job’s step with a call to this new one in msdb. If you call it with a null parameter for database_name, it will cycle through each mirrored database, passing the appropriate name when raising the error.

USE [msdb]
GO
 
/****** This is a modified version of sys.dbmmonitorupdate which raises customized errors for mirroring to include the dbname. 
Written by Steven Wright, SQL Sentry ******/
 
SET ANSI_NULLS ON
GO
 
SET QUOTED_IDENTIFIER ON
GO
 
 
CREATE procedure [dbo].[sp_Sentry_dbmmonitorupdate] 
(
    @database_name        sysname = null    -- if null update all mirrored databases
)
as
begin
    set nocount on
    if (is_srvrolemember(N'sysadmin') <> 1 )
    begin
        raiserror(21089, 16, 1)
        return 1
    end
    if ( db_name() != N'msdb' )
    begin
        raiserror(32045, 16, 1, N'msdb..sp_Sentry_dbmmonitorupdate')
        return 1
    end
 
    declare        @retcode    int
 
    if object_id ( N'msdb.dbo.dbm_monitor_data', N'U' ) is null
    begin 
        create table msdb.dbo.dbm_monitor_data (        -- go through the code to see if there SHOULD be nulls.
            database_id                smallint,
            role                    bit null,
            status                    tinyint null,
            witness_status            tinyint null,
            log_flush_rate            bigint null,
            send_queue_size            bigint null,
            send_rate                bigint null,
            redo_queue_size            bigint null,
            redo_rate                bigint null,
            transaction_delay        bigint null,
            transactions_per_sec    bigint null,
            time                    datetime,
            end_of_log_lsn            numeric(25,0),
            failover_lsn            numeric(25,0),
            local_time                datetime
        )
 
        exec @retcode = msdb.dbo.sp_MS_marksystemobject dbm_monitor_data
        if ( @@error != 0 OR @retcode != 0 )
        begin
            raiserror( 32038, 16, 1 )
            return 1
        end
 
        create clustered index dbmmonitor1 
            on msdb.dbo.dbm_monitor_data (database_id asc, time asc )
    end
 
    -- TO DO: create some keys depending on enterences.
    -- TO DO: make sure that the rows are unique
    if object_id ( N'msdb.dbo.dbm_monitor_alerts', N'U' ) is null
    begin
        create table msdb.dbo.dbm_monitor_alerts (
            database_id                smallint,
            retention_period        int null,    --this defaults to 7 days.  checked during the table update
            time_behind                int null,
            enable_time_behind        bit null,
            send_queue                int null,
            enable_send_queue        bit null,
            redo_queue                int null,
            enable_redo_queue        bit null,
            average_delay            int null,
            enable_average_delay    bit null
        )
 
        exec @retcode = msdb.dbo.sp_MS_marksystemobject dbm_monitor_alerts
        if ( @@error != 0 OR @retcode != 0 )
        begin
            raiserror( 32038, 16, 2 )
            return 1
        end
    end
 
    if ( select name from sys.database_principals where name = N'dbm_monitor') is null 
    begin
        create role dbm_monitor
        grant select on object::msdb.dbo.dbm_monitor_data to dbm_monitor
    end
 
    if @database_name is not null
    begin
        --
        -- Check if the database specified exists 
        --
        if not exists (select * from master.sys.databases where name = @database_name)
        begin
            raiserror(15010, 16, 1, @database_name)
            return 1
        end
        -- 
        -- Check to see if it is mirrored
        --
        if (select mirroring_guid from master.sys.database_mirroring where database_id = db_id(@database_name)) is null 
        begin
            raiserror(32039, 16, 1, @database_name)
            return 1
        end
 
    declare
        @database_id            smallint,
        @role                    bit,
        @status                    tinyint,
        @witness_status            tinyint,
        @log_flush_rate            bigint ,
        @send_queue_size        bigint ,
        @send_rate                bigint ,
        @redo_queue_size        bigint ,
        @redo_rate                bigint ,
        @transaction_delay        bigint ,
        @transactions_per_sec    bigint ,
        @time                    datetime ,
        @end_of_log_lsn            numeric(25,0),
        @failover_lsn            numeric(25,0),
        @local_time                datetime
 
    declare
        @retention_period        int,
        @oldest_date            datetime
 
        set @database_id = DB_ID( @database_name )
 
-- To select the correct perf counter, we need the instance name.
        declare 
            @perf_instance1        nvarchar(256),
            @perf_instance2        nvarchar(256),
            @instance            nvarchar(128)
 
        select @instance = convert( nvarchar,  serverproperty(N'instancename'))
        if @instance is null
        begin
            set @instance = N'SQLServer'
        end
        else
        begin
            set @instance = N'MSSQL$' + @instance
        end
 
        set @perf_instance1 = left(@instance, len(@instance)) + N':Database Mirroring'
        set @perf_instance2 = left(@instance, len(@instance)) + N':Databases'
 
--
-- Insert a single row in the table for each database
--
-- 1. Pull out the perf counters
-- 2. Pull out the information from sys.database_mirroring
-- 3. Get the end of log lsn
 
        declare @perfcounters table(
            counter_name        nchar(128),
            cntr_value            bigint
        )
 
        insert into @perfcounters select counter_name, cntr_value from sys.dm_os_performance_counters where
            (object_name = @perf_instance1 or object_name = @perf_instance2 ) and 
            instance_name = @database_name and
            counter_name IN (N'Log Send Queue KB', N'Log Bytes Sent/sec', N'Redo Queue KB', N'Redo Bytes/sec', N'Transaction Delay', N'Log Bytes Flushed/sec', N'Transactions/sec')
        -- TO DO select all perfcounters for all databases so that you only need to access them once.
        select @role = (mirroring_role - 1),
            @status = mirroring_state, 
            @witness_status = mirroring_witness_state,
            @failover_lsn = mirroring_failover_lsn,
            @end_of_log_lsn = mirroring_end_of_log_lsn
                from sys.database_mirroring where database_id = @database_id
        -- TO DO: when doing the join, store the database id.
        select @log_flush_rate = cntr_value from @perfcounters where counter_name = N'Log Bytes Flushed/sec'
        select @send_queue_size = cntr_value from @perfcounters where counter_name = N'Log Send Queue KB'
        select @send_rate = cntr_value from @perfcounters where counter_name = N'Log Bytes Sent/sec'
        select @redo_queue_size = cntr_value from @perfcounters where counter_name = N'Redo Queue KB'
        select @redo_rate = cntr_value from @perfcounters where counter_name = N'Redo Bytes/sec'
        select @transaction_delay = cntr_value from @perfcounters where counter_name = N'Transaction Delay'
        select @transactions_per_sec = cntr_value from @perfcounters where counter_name = N'Transactions/sec'
        set @time = getutcdate()
        set @local_time = getdate()
 
-- 4. and insert it here
        insert into msdb.dbo.dbm_monitor_data (database_id, role, status, witness_status, failover_lsn, end_of_log_lsn, log_flush_rate,
                send_queue_size, send_rate, redo_queue_size, redo_rate, transaction_delay, transactions_per_sec, time, local_time)
        values( @database_id, @role, @status, @witness_status, @failover_lsn, @end_of_log_lsn, @log_flush_rate, @send_queue_size, @send_rate,
            @redo_queue_size, @redo_rate, @transaction_delay, @transactions_per_sec, @time, @local_time )
 
        -- 
        -- Raise the alerts (as errors)
        --
        --
        -- we need to call sys.sp_dbmmonitorresults to get the last row inserted and then we will compare those results with what is in the alerts table
        --
        declare    @alert        bit,
                @threshold    int,
                @command    char(256),
                @time_behind_alert_value    datetime,
                @send_queue_alert_value        int,
                @redo_queue_alert_value        int,
                @average_delay_alert_value    int,
                @temp_time                    int
 
        declare @results table(
            database_name            sysname,    -- Name of database
            role                    int,        -- 1 = Principal, 2 = Mirror
            mirroring_state            int,        -- 0 = Suspended, 1 = Disconnected, 2 = Synchronizing, 3 = Pending Failover, 4 = Synchronized
            witness_status            int,        -- 1 = Connected, 2 = Disconnected
            log_generation_rate        int NULL,    -- in kb / sec
            unsent_log                int,        -- in kb
            send_rate                int NULL,    -- in kb / sec
            unrestored_log            int,        -- in kb
            recovery_rate            int NULL,    -- in kb / sec
            transaction_delay        int NULL,    -- in ms
            transactions_per_sec    int NULL,    -- in trans / sec
            average_delay            int,        -- in ms
            time_recorded            datetime,
            time_behind                datetime,
            local_time                datetime        
        )
 
        set @command = N'sys.sp_dbmmonitorresults ''' + replace(@database_name, N'''',N'''''') + N''',0,0'
        -- get just the values we want to test
        insert into @results exec (@command)
        select @time_behind_alert_value = time_behind, @send_queue_alert_value = unsent_log,
                @redo_queue_alert_value = unrestored_log, @average_delay_alert_value = average_delay
        from @results where database_name = @database_name
 
        -- These next four code blocks are the same:
        --    If the alert is enabled AND the value is above the threshold, fire the event
        -- The four code blocks are time behind, send queue, redo queue and average delay.
 
        -- time behind
        set @alert = 0    -- from SteveLi.  This will make sure that if there are problems with the select, the alert
                        -- will not accidentally fire.
        select @threshold = time_behind, @alert = enable_time_behind
            from msdb.dbo.dbm_monitor_alerts where database_id = @database_id
        begin
            set @temp_time = datediff(minute, @time_behind_alert_value, getutcdate())
            if ( @alert = 1 and @threshold < @temp_time ) -- time_behind_alert_value is datetime
            begin
                raiserror( 52040, 10, 1, @database_name, @temp_time, @threshold ) with log
            end
        end
        -- send queue
        set @alert = 0
        select @threshold = send_queue, @alert = enable_send_queue
            from msdb.dbo.dbm_monitor_alerts where database_id = @database_id
        begin
            if ( @alert = 1 and @threshold < @send_queue_alert_value )
            begin
                raiserror( 52042, 10, 2, @database_name, @send_queue_alert_value, @threshold ) with log
            end
        end
        -- redo queue
        set @alert = 0
        select @threshold = redo_queue, @alert = enable_redo_queue
            from msdb.dbo.dbm_monitor_alerts where database_id = @database_id
        begin
            if ( @alert = 1 and @threshold < @redo_queue_alert_value )
            begin
                raiserror( 52043, 10, 3, @database_name,@redo_queue_alert_value, @threshold ) with log
            end
        end
        -- average delay
        set @alert = 0
        select @threshold = average_delay, @alert = enable_average_delay
            from msdb.dbo.dbm_monitor_alerts where database_id = @database_id
        begin
            if ( @alert = 1 and @threshold < @average_delay_alert_value )
            begin
                raiserror( 52044, 10, 4, @database_name,@average_delay_alert_value, @threshold ) with log
            end
        end
 
        -- Prune the Data Table.
        select @retention_period = retention_period from msdb.dbo.dbm_monitor_alerts where database_id = @database_id
        if @retention_period is null
            set @retention_period = 168 -- 168 hours is equivalent to 7 days
        set @oldest_date = getutcdate() - (@retention_period / 24.)
        delete from msdb.dbo.dbm_monitor_data where time < @oldest_date and database_id = @database_id
    end
    -- OK, this SP was called with no database specified.
    -- We are going to go through all the databases that are mirrored and update them.
    else
    begin
        declare dbmCursor cursor local scroll 
            for select 
                database_id 
            from sys.database_mirroring 
            where mirroring_guid is not null
 
        open dbmCursor
        fetch next from dbmCursor
            into @database_id
 
        while @@fetch_status=0
        begin
-- Better make sure msdb..sp_Sentry_dbmmonitorupdate with a null parameter.  Could cause real bad problems.
            set @database_name = db_name( @database_id )
            if @database_name is not null
            begin
                
                exec msdb..sp_Sentry_dbmmonitorupdate @database_name
                fetch next from dbmCursor
                    into @database_id
            end
        end
 
        close dbmCursor
        deallocate dbmCursor
    end
 
return 0
end
 
GO

Download the script directly here: Create_Sentry_dbmmupdate.sql

Finally we need to create our SQL Agent Alerts that are fired when these errors are raised. SQL Sentry Event Manager can monitor these alerts. This allows us to automate responses, such as sending an email, or take other more advanced actions that SQL Sentry provides. We can then create a custom view that allows us to see a chronological, Outlook-style calendar picture of this activity alongside any other events like high impact queries that may trigger our alerts.

In addition to the four performance thresholds covered by the errors we’ve created, I’ve added some additional alerts for monitoring status changes such as mirror failovers as well as monitoring for automatic page repair. Automatic page repair is a great feature that was introduced with SQL 2008 and provides for automatic repair of corrupt pages using the partner database since it is an exact copy.

Paul Randal (b|t) has more details about automatic page repair in his blog.

So here is the script to create the alerts. Note I tried to keep the format as similar to that used in the original TechNet article for consistency.

USE [msdb];
GO
 
DECLARE @ReturnCode INT;
SELECT @ReturnCode = 0;
 
-- ***************
-- Create a set of alerts based on performance warnings
-- ***************
IF NOT EXISTS (SELECT name FROM msdb.dbo.syscategories WHERE 
   name=N'Database Mirroring' AND category_class=2)
BEGIN
EXEC @ReturnCode = msdb.dbo.sp_add_category @class=N'ALERT', 
   @type=N'NONE', @name=N'Database Mirroring';
IF (@@ERROR <> 0 OR @ReturnCode <> 0) GOTO Quit_Alert;
 
END;
 
DECLARE @alertName NVARCHAR(200);
-- Create [DBM Perf: Unsent Log Threshold Exceeded]
SELECT @alertName = N'DBM Perf: Unsent Log Threshold Exceeded';
EXEC msdb.dbo.sp_add_alert 
   @name=@alertName, 
   @category_name=N'Database Mirroring',
   @message_id=52042, 
   @severity=0, 
   @delay_between_responses=60, 
   @include_event_description_in=0,
   @enabled=1;
 
-- Create [DBM Perf: Oldest Unsent Transaction Threshold Exceeded]
SELECT @alertName = N'DBM Perf: Oldest Unsent Transaction Threshold Exceeded';
EXEC msdb.dbo.sp_add_alert 
   @name=@alertName, 
   @category_name=N'Database Mirroring',
   @message_id=52040, 
   @severity=0, 
   @delay_between_responses=60, 
   @include_event_description_in=0,
   @enabled=1;
 
-- Create [DBM Perf: Unrestored Log Threshold Exceeded]
SELECT @alertName = N'DBM Perf: Unrestored Log Threshold Exceeded';
EXEC msdb.dbo.sp_add_alert 
   @name=@alertName, 
   @category_name=N'Database Mirroring',
   @message_id=52043, 
   @severity=0, 
   @delay_between_responses=60, 
   @include_event_description_in=0,
   @enabled=1;
 
-- Create [DBM Perf: Mirror Commit Overhead Threshold Exceeded]
SELECT @alertName = N'DBM Perf: Mirror Commit Overhead Threshold Exceeded';
EXEC msdb.dbo.sp_add_alert 
   @name=@alertName, 
   @category_name=N'Database Mirroring',
   @message_id=52044, 
   @severity=0, 
   @delay_between_responses=60, 
   @include_event_description_in=0,
   @enabled=1;
 
 
-- Create [DBM Status: Mirroring Role Change]
SELECT @alertName = N'DBM Status: Mirroring Role Change';
EXEC msdb.dbo.sp_add_alert 
   @name=@alertName, 
   @category_name=N'Database Mirroring',
   @message_id=1480, 
   @severity=0, 
   @delay_between_responses=60, 
   @include_event_description_in=0,
   @enabled=1;
 
-- Create [DBM Status: Mirroring Active as Principal]
SELECT @alertName = N'DBM Status: Mirroring Active as Principal';
EXEC msdb.dbo.sp_add_alert 
   @name=@alertName, 
   @category_name=N'Database Mirroring',
   @message_id=1440, 
   @severity=0, 
   @delay_between_responses=60, 
   @include_event_description_in=0,
   @enabled=1;
 
-- Create [DBM Status: Mirroring Active as Mirror]   
SELECT @alertName = N'DBM Status: Mirroring Active as Mirror';
EXEC msdb.dbo.sp_add_alert 
   @name=@alertName, 
   @category_name=N'Database Mirroring',
   @message_id=1441, 
   @severity=0, 
   @delay_between_responses=60, 
   @include_event_description_in=0,
   @enabled=1;   
   
-- Create [DBM Status: Mirror Inactive]
SELECT @alertName = N'DBM Status: Mirror Inactive';
EXEC msdb.dbo.sp_add_alert 
   @name=@alertName, 
   @category_name=N'Database Mirroring',
   @message_id=1442, 
   @severity=0, 
   @delay_between_responses=60, 
   @include_event_description_in=0,
   @enabled=1;   
   
-- Create [DBM Status: Mirror Terminated]
SELECT @alertName = N'DBM Status: Mirror Terminated';
EXEC msdb.dbo.sp_add_alert 
   @name=@alertName, 
   @category_name=N'Database Mirroring',
   @message_id=1443, 
   @severity=0, 
   @delay_between_responses=60, 
   @include_event_description_in=0,
   @enabled=1;
  
-- Create [DBM Automatic Page Repair: In Progress]
SELECT @alertName = N'DBM Automatic Page Repair: In Progress';
EXEC msdb.dbo.sp_add_alert 
   @name=@alertName, 
   @category_name=N'Database Mirroring',
   @message_id=1432, 
   @severity=0, 
   @delay_between_responses=60, 
   @include_event_description_in=0,
   @enabled=1;
   
-- Create [DBM Automatic Page Repair: Successful]
SELECT @alertName = N'DBM Automatic Page Repair: Successful';
EXEC msdb.dbo.sp_add_alert 
   @name=@alertName, 
   @category_name=N'Database Mirroring',
   @message_id=1461, 
   @severity=0, 
   @delay_between_responses=60, 
   @include_event_description_in=0,
   @enabled=1;
   
-- Create [DBM Automatic Page Repair: Failed]
SELECT @alertName = N'DBM Automatic Page Repair: Failed';
EXEC msdb.dbo.sp_add_alert 
   @name=@alertName, 
   @category_name=N'Database Mirroring',
   @message_id=1481, 
   @severity=0, 
   @delay_between_responses=60, 
   @include_event_description_in=0,
   @enabled=1;
Quit_Alert:

Download the script directly here: Mirror_Alerts.sql

We’ve now successfully created our workaround and should be getting properly detailed alerts based on those conditions. Remember to run these scripts on both your principal and mirror server for complete coverage.

Increased Visibility and Notification with SQL Sentry

Now that we’ve set up reliable detection of our mirroring thresholds, let’s take a look at the increased visibility and automation that can be provided with SQL Sentry Event Manager.

SQL Sentry Event Manager can monitor many SQL related events and show this activity in an Outlook-style calendar view. Among the events that can be monitored and shown are SQL Agent Alerts like the ones we just created.

In our Log Shipping and Replication whitepaper, we show you how to create Custom Event Views for providing visibility into log shipping and replication activity. The same functionality can be applied to mirroring and the mirroring alerts we created. In fact, if you are monitoring your mirrored servers with Event Manager and Performance Advisor, known as the SQL Sentry Power Suite, you can add any Top SQL statements to the view. This allows you to see historically, the exact times high impact queries were executing alongside any mirroring alerts that were likely generated due to the extra load as shown in the example screenshot.

mirperfalert

Notice we get our status alerts too. In the above test I ran queries to generate enough activity against the mirrored database to trigger some of our performance alerts. I can see and be notified of mirror failovers the same way as seen below.

mirfail

With both scenarios I get confirmation from both sides of the mirror because I’ve set up my alerts on both the principal instance and the mirror instance. The same visibility and notification applies to my automatic page repair alerts.

Automation

Monitoring your mirrors with Event Manager can allow you to add automation to your environment as well. The most common action would be to get emails or pages when these alerts are raised. That is basic functionality in Event Manager without the need for database mail. You can get a quick review on setting up notifications in the SQL Sentry User Guide.

Another example might involve an application that requires access to multiple mirrored databases on the same server. Should one failover, you want them all to failover together. SQL Sentry’s Execute SQL actions allow you to do just that. Simply enter the appropriate commands in the Execute SQL action for this alert, and SQL Sentry can automate the failover of the other mirror.

Director of Client Services, Jason Hall (b|t), has a blog post detailing the use of Execute Actions in SQL Sentry.

New in SQL Sentry Version 7

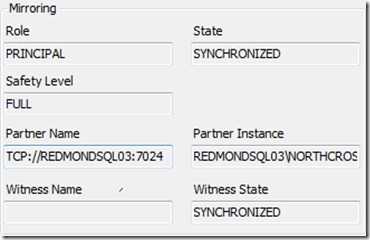
SQL Sentry version 7 has added even more visibility into mirroring. First you may have noticed a new node under your SQL Server instances in the Navigator pane labeled Databases. Double clicking on a database provides details including mirroring information.

mirinfo

Additionally, you may have noticed new metrics in the Performance Advisor dashboard. In the upper right, we have provided a chart for backup throughput. In version 7, should we detect at least one mirrored database on the instance, we’ll show Send and Redo Queue size as well. This provides both real time and historical views into the size of either queue.

queuehist

When you combine this with the calendar visibility for these events and alerting on all these mirroring thresholds and status events, you get comprehensive coverage and can rest assured you’ll know whenever your mirrored databases experience any issues.  If you haven’t already, download a free evaluation copy of the complete SQL Sentry Suite at http://www.sqlsentry.net/download-trial/trial.asp.  And if you have any questions, don’t hesitate to contact me or the rest of the team by emailing support at sqlsentry.net.